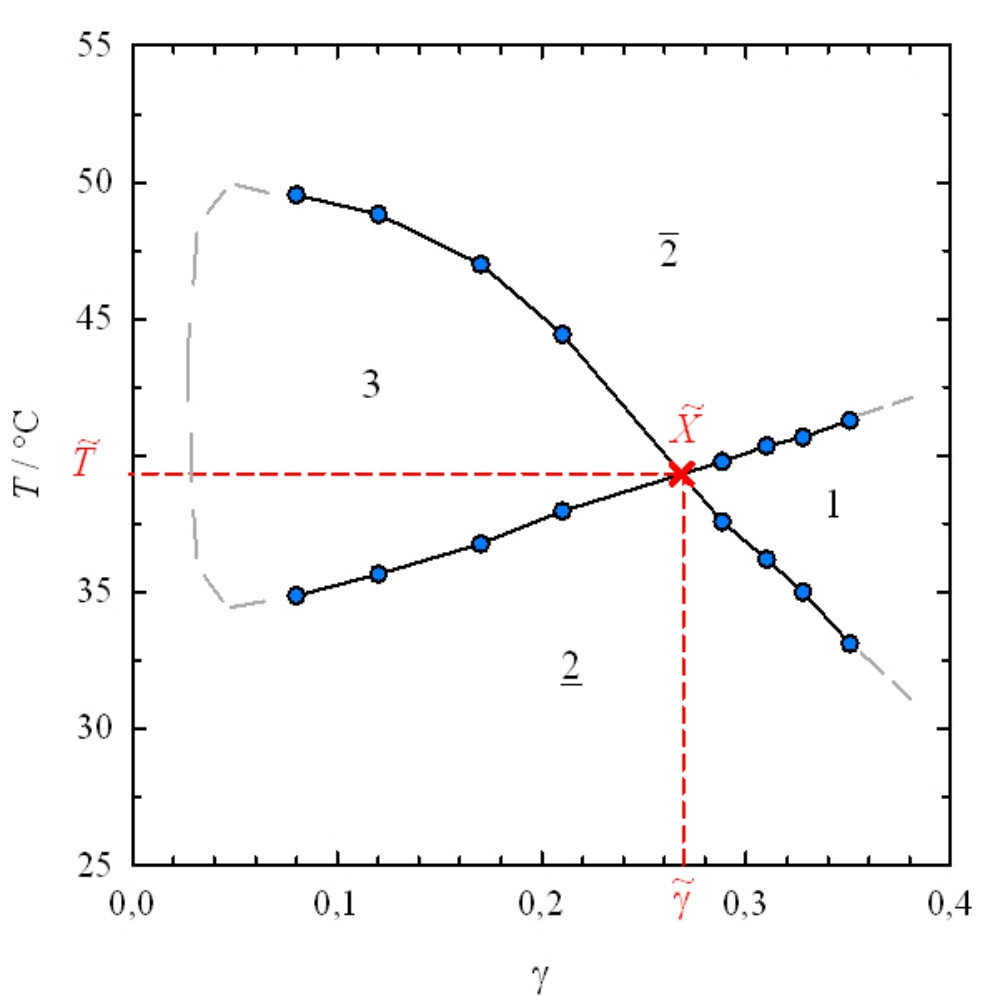
To measure the phase diagram of a multi-component system, e.g. a microemulsion, the phase transition temperatures for various compositions of the system have to be identified. Usually the varied composition parameter is the surfactant massfraction of the mixture, i.e. γ = mSurfactant / mtotal, yielding a T(γ) diagram.
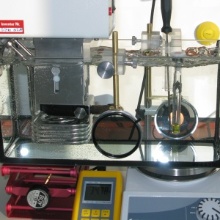
For each investigated composition the mixture is visually examined at different temperatures to identify the respective state of the system. The water basins are equipped with a thermostate (Thermo Scientific DC30) that allows for accurate temperature control (± 0.1 K). A digital thermometer (Greisinger GMH 375) is used to measure the temperature with an accuracy of 0.01 K.
Usually the sample tube which is attached to a sample holder is equipped with a magnetic bar so the system can be mixed during the procedure as there is a magnetic stirrer (Heidolph MR Hei-Mix L) placed under the basin. Apart from quick equilibration after temperature changes this has another huge advantage. Stirring the system helps to easily distinguish between one- and two-phase regions of the phase diagram. Given that every single phase is a transparent isotropic liquid a one-phase system will appear as a clear liquid, despite stirring, while in the two-phase region mixing the two phases will result in a turbid emulsion. To help the experimentator see that there is a lamp (Gerhardt Belani) placed behind the basin that shines vis-light through the sample which is scattered at the emulsion droplets.
Furthermore, turnable polarization filters (hama Pol circular) in front of and behind the basin allow for recognizion of liquid cristalline phases.
To identify the phase transition temperatures a protocol of reducing temperatur step size is applied. Finally, when a transition temperature is narrowed down as much as desired it can be put in the phase diagram an example of which is shown in fig. 1. Extrapolation of the experimentally found points gives the phase boundaries and allows for determination of the characteristic X̃-point of the system.

Jessica Bauhof
Doctoral Researcher